I’m such a noob here so don’t be too harsh if I say something stupid please hehe.
I’m still trying to set up VS Code properly to compile and debug using the examples from the DaisyExamples repo and there’s something I don’t get here:
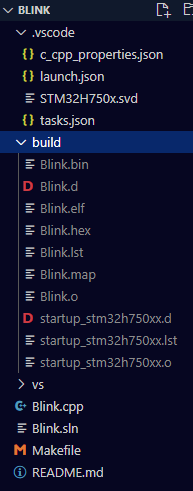
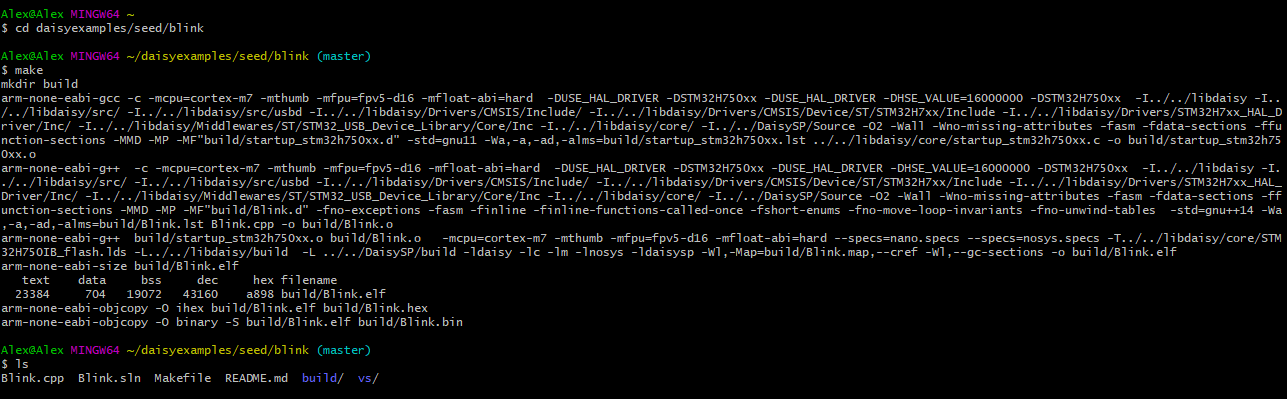
If I use GitBash inside, let’s say de Blink example folder, and type make it builds all the necessary files:
and the “build” folder is created inside de Blink folder:
Cool.
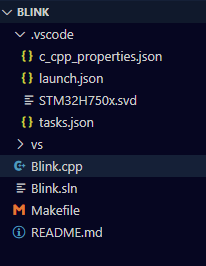
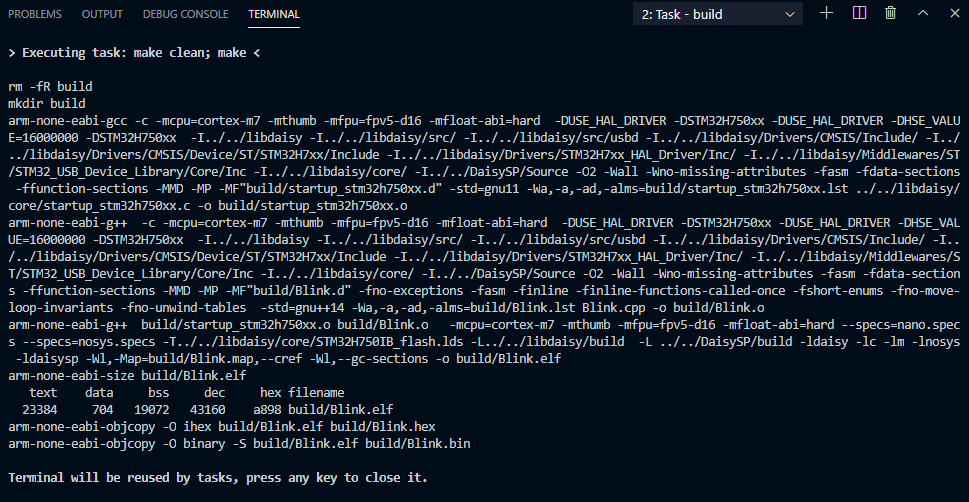
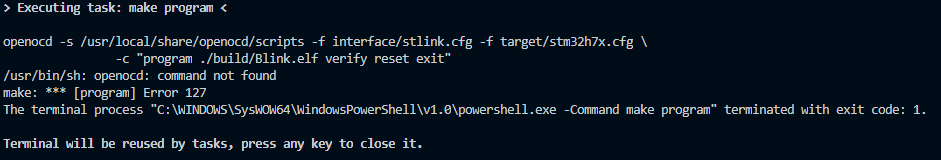
If I’m in VSC with my Blink project open and type “make” in the terminal or click on Terminal > Run Build Task (which form the “tasks.json” I’ve figured out is the same thing) the files are supposed to be created:
I don’t get iiiiit!!! Is this of any importance? Should I be worried about trying to compile and flash my own programs or everything is going to just work anyway?
I still have to get into creating my own project and coding on my own, any particular workflow or configuration for VSC recommended to make sure everything runs smoothly?
Thanks everyone and keep building this amazing comunity!
Openocd is used for programming and debugging with hardware programer (ST-Link). It’s not found on your machine, apparently. But you don’t use that programmer, so it doesn’t matter.
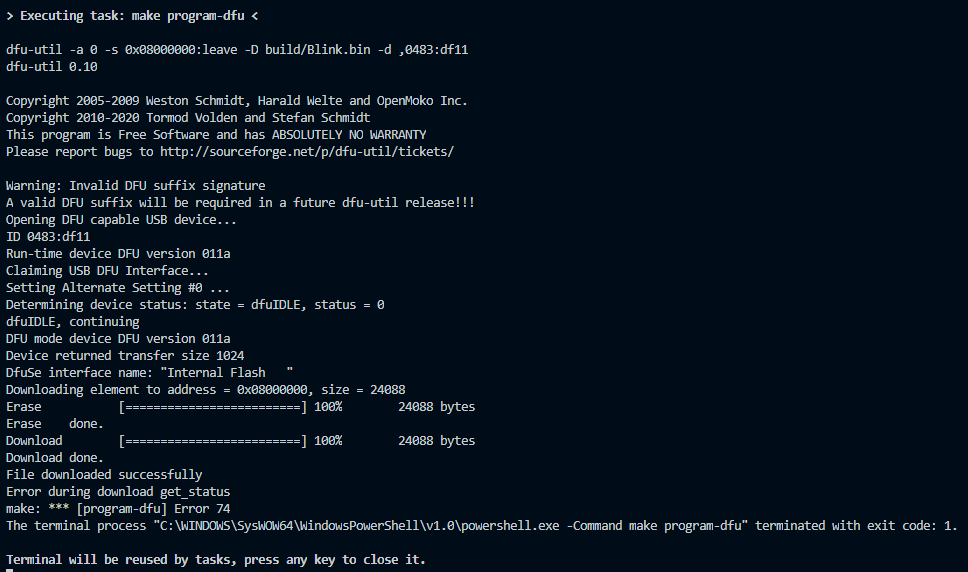
DFU mode is used to flash your application binary and it only uses USB connection.
That last error happens on some versions of dfu-util, it’s a false alarm that you can ignore.
Good to know the las error is just a false alarm, it was anoying me a bit haha Is there any way I can debug with the DFU mode as I would with an ST-Link or do I have to use an ST-Link no matter what?
There is a Logger class in libdaisy that would allow you to print-style debugging, but there isn’t currently a method for actual debugging (a la breakpoints, stack traces, etc.) via USB.
The DaisySeed class has wrappers for the common logger functions: StartLogPrint and PrintLine
Hey! I’ve been trying the Logger class to print the knob values of a tremolo effect but I don’t know how to make it work. Are there any commands I have to type on the VSC terminal? Because I flashed the logger example as in your post but I don’t get anything on screen.
There must be something I’m missing. Can you think about something that happened to you when you started using this?
The Logger class allows the daisy to appear as a virtual COM Port on a host (PC). So just having the code won’t start updating anything on your VS Code screen. In order to read what is being output you’ll need to use a Serial Monitor of some sort.
If you have Arduino installed, you can open it up and use the Tools->Serial Monitor from there. There are also other programs available depending on your OS (like PuTTY on Windows). Depending on your OS the Daisy will show up with a different name, but it should appear/disappear when you connect the cable. For example, the one connected to my PC right now shows up as COM7. It should also have a name in device manager/system information, like “STM32 Virtual ComPort” or “Daisy Seed Built In”
You can also use linux cli tools as @StaffanMelin mentioned above.
I have been looking around for code sample showing how to use the ST-Link + debug output and I am not sure I have found the answer quite yet… or at least a code sample where I can look at it and go - OK, I think I have it. Any help or pointers here would be greatly appreciated.
here is my situation:
I am using the external USB port for MIDI over USB
I am using the internal USB port for the ST Link debugger
I would like to be able to do some debug output prints for timing and other data while still debugging with the ST Link. This looks very possible from what I have read, but I am not clear on how to set this up in code.
Any and all help here would be greatly appreciated in helping me with a code example for doing this.
Here’s a video (timestamped link) where debug is demonstrated. I hope this is what you were looking for. There’s a link in the description where you can learn more about debugging.
If you were looking for a specific type of code, would you tell us more about what you want to accomplish? Feel free to get specific about your project
Thank you for the link, I do have all of that up and running and have been debugging quite a bit via breakpoints and such.
What I am looking to do is use the logger and be able to print debug info, such as timing data, so I can keep the system running and look for timing glitches.
In looking at this link that discusses the logger I noticed it talks about using the “Logger<LOGGER_SEMIHOST>” but it was not clear to me how to set this up.
In short i’m looking to be able to do a logger.PirntLine to put out timing data when VSCode is running via the ST-Link [Edit removed part of this line].
[update]
When the internal USB is in use, what is the proper way to have debug output go to/through the ST-Link, if that is possible at all.
Thank you for your help so far, it is greatly appreciated.