I made a vocoder that runs on Daisy Seed. It uses 31 bands (each 4 semitones / 1 one terts wide) and has a flexible modulation matrix. You can hear some audio examples here:
and here:
The latter demo includes a track I made using a file based version of the vocoder I wrote years ago the core of which I based the Daisy version on. In this track all string like sounds were produced using the vocoder.
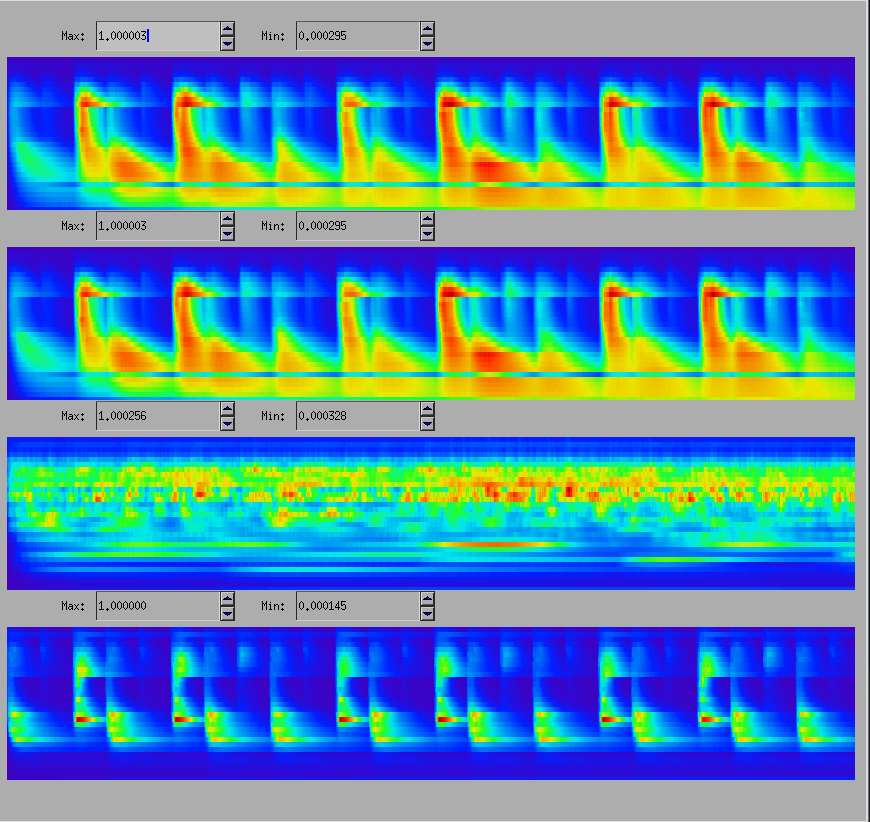
I’d love to add a spectral display to the Daisy that in kind of a waterfall way shows the energy levels in the frequency bands scrolling by, but I have not found a way to do that yet. This display should be able to show 4 * 31 horizontal lines of spectral energy levels. I’m imagining that each spectral band occupies one horizontal line on the screen and the band’s energy is displayed in color as in this picture:
That’s some magic! I love the sounds that your vocoder makes. I think your a great teacher also. The graphics you put together layout a complex patch in a simple manner, one by one, adding more functionality until the final result is achieved. Good job!
I happen to be a Ham Radio Operator (call KB8WOW) amongst other things and we use waterfall displays for analyzing portions of the RF spectrum in search of other stations to connect with. While the displays that I use normally reserve the vertical axis for time (pixels at the bottom are the oldest sampled data), I have seen several that look closer to a regular spectrum analyzer (oldest samples are at the right of the display).
You might like to plunge into the subject starting with Matlab then see what others are doing in Arduino environment or search GitHub where there are some Python and C and C++ and Javascript examples to get you in the mood.
Good luck. Keep us informed of how you’re progressing. If you have questions, don’t hesitate to ask. The folks here are kind, helpful, and friendly!
Indeed a horizontal waterfall display could do the trick. I got the idea from looking into software defined radio a while ago.
I have been thinking of looking into using a Raspberry PI with a HDMI display as a HAT and send the data via a serial line to it offloading the displaying from the Daisy to the RPI, so that the Daisy can concentrate on the filtering work.
What hardware/software is used to display waterfall displays in the Ham radio world?
In Ham Radio land, waterfall displays are most prevalent in the use of a digital communication mode called PSK31. The majority of Hams use their PC or Laptop with one of the many PSK31 programs that are available. Some do grow their own, however, and the majority of those who do have chosen the very thing that your looking at (RPI + HAT). That’s why I selected Linux for OS for the blue link above.
Before pulling the trigger on any purchases I encourage you read up on FFTs, Spectrum Analyzers, Spectrograph Tools. In the article they use a Teensy3.0 but any fast microcontroller can be used and the principle information is relevant regardless of the hardware.
I’m not sure if I fully understand what you want to display. A spectrogram uses an audio signal and displays the matrix of time and frequency domains. By the diagram you posted it appears to me that you want to display 4 audio signals. If that’s the case, how are you going to generate those signals (or data) for external circuitry? I haven’t looked at code yet, but your repo looks well organized and I’d bet you could identify 4 places in your audio callback to represent the 4 signals you want to graph. Then it would just be a matter of sending those values (via SPI?) to a Raspberry PI.
The vocoding process is based on computing envelopes of frequency bands. The envelope values are proportional to the energy in those bands. So 31 band of the modulator will lead to 31 energy values per unit of time. The code already also computes the envelope of all carrier filter bands and of the bands of the left and right output (these are not used in the vocoding process). In total per unit of time this results in 4 * 31 energy values. I want to display them similarly to the picture I posted earlier as a vertical series of color pixels for a given time and the values for the following moment as a vertical series of color pixels next to that and so on, and so.
So let’s imagine a 1280 x 800 screen as an Excel spreadsheet with the one axis being horizontal columns labeled A,B,C… and the other axis being vertical rows labeled 1,2,3…
I’m going to assume for now that each individual energy reading will be mapped to a common color palette.
Am I correct in stating that each column will represent a point in time and each time a new set of readings become available that any existing data gets shifted by one column to the right and the new readings will be displayed in column A and if all of the visible columns are filled the oldest set of readings is discarded? In essence, every row represents history of a single energy reading from one of 4 groups with the newest value always in column A and the oldest value always occupying the rightmost visible column.
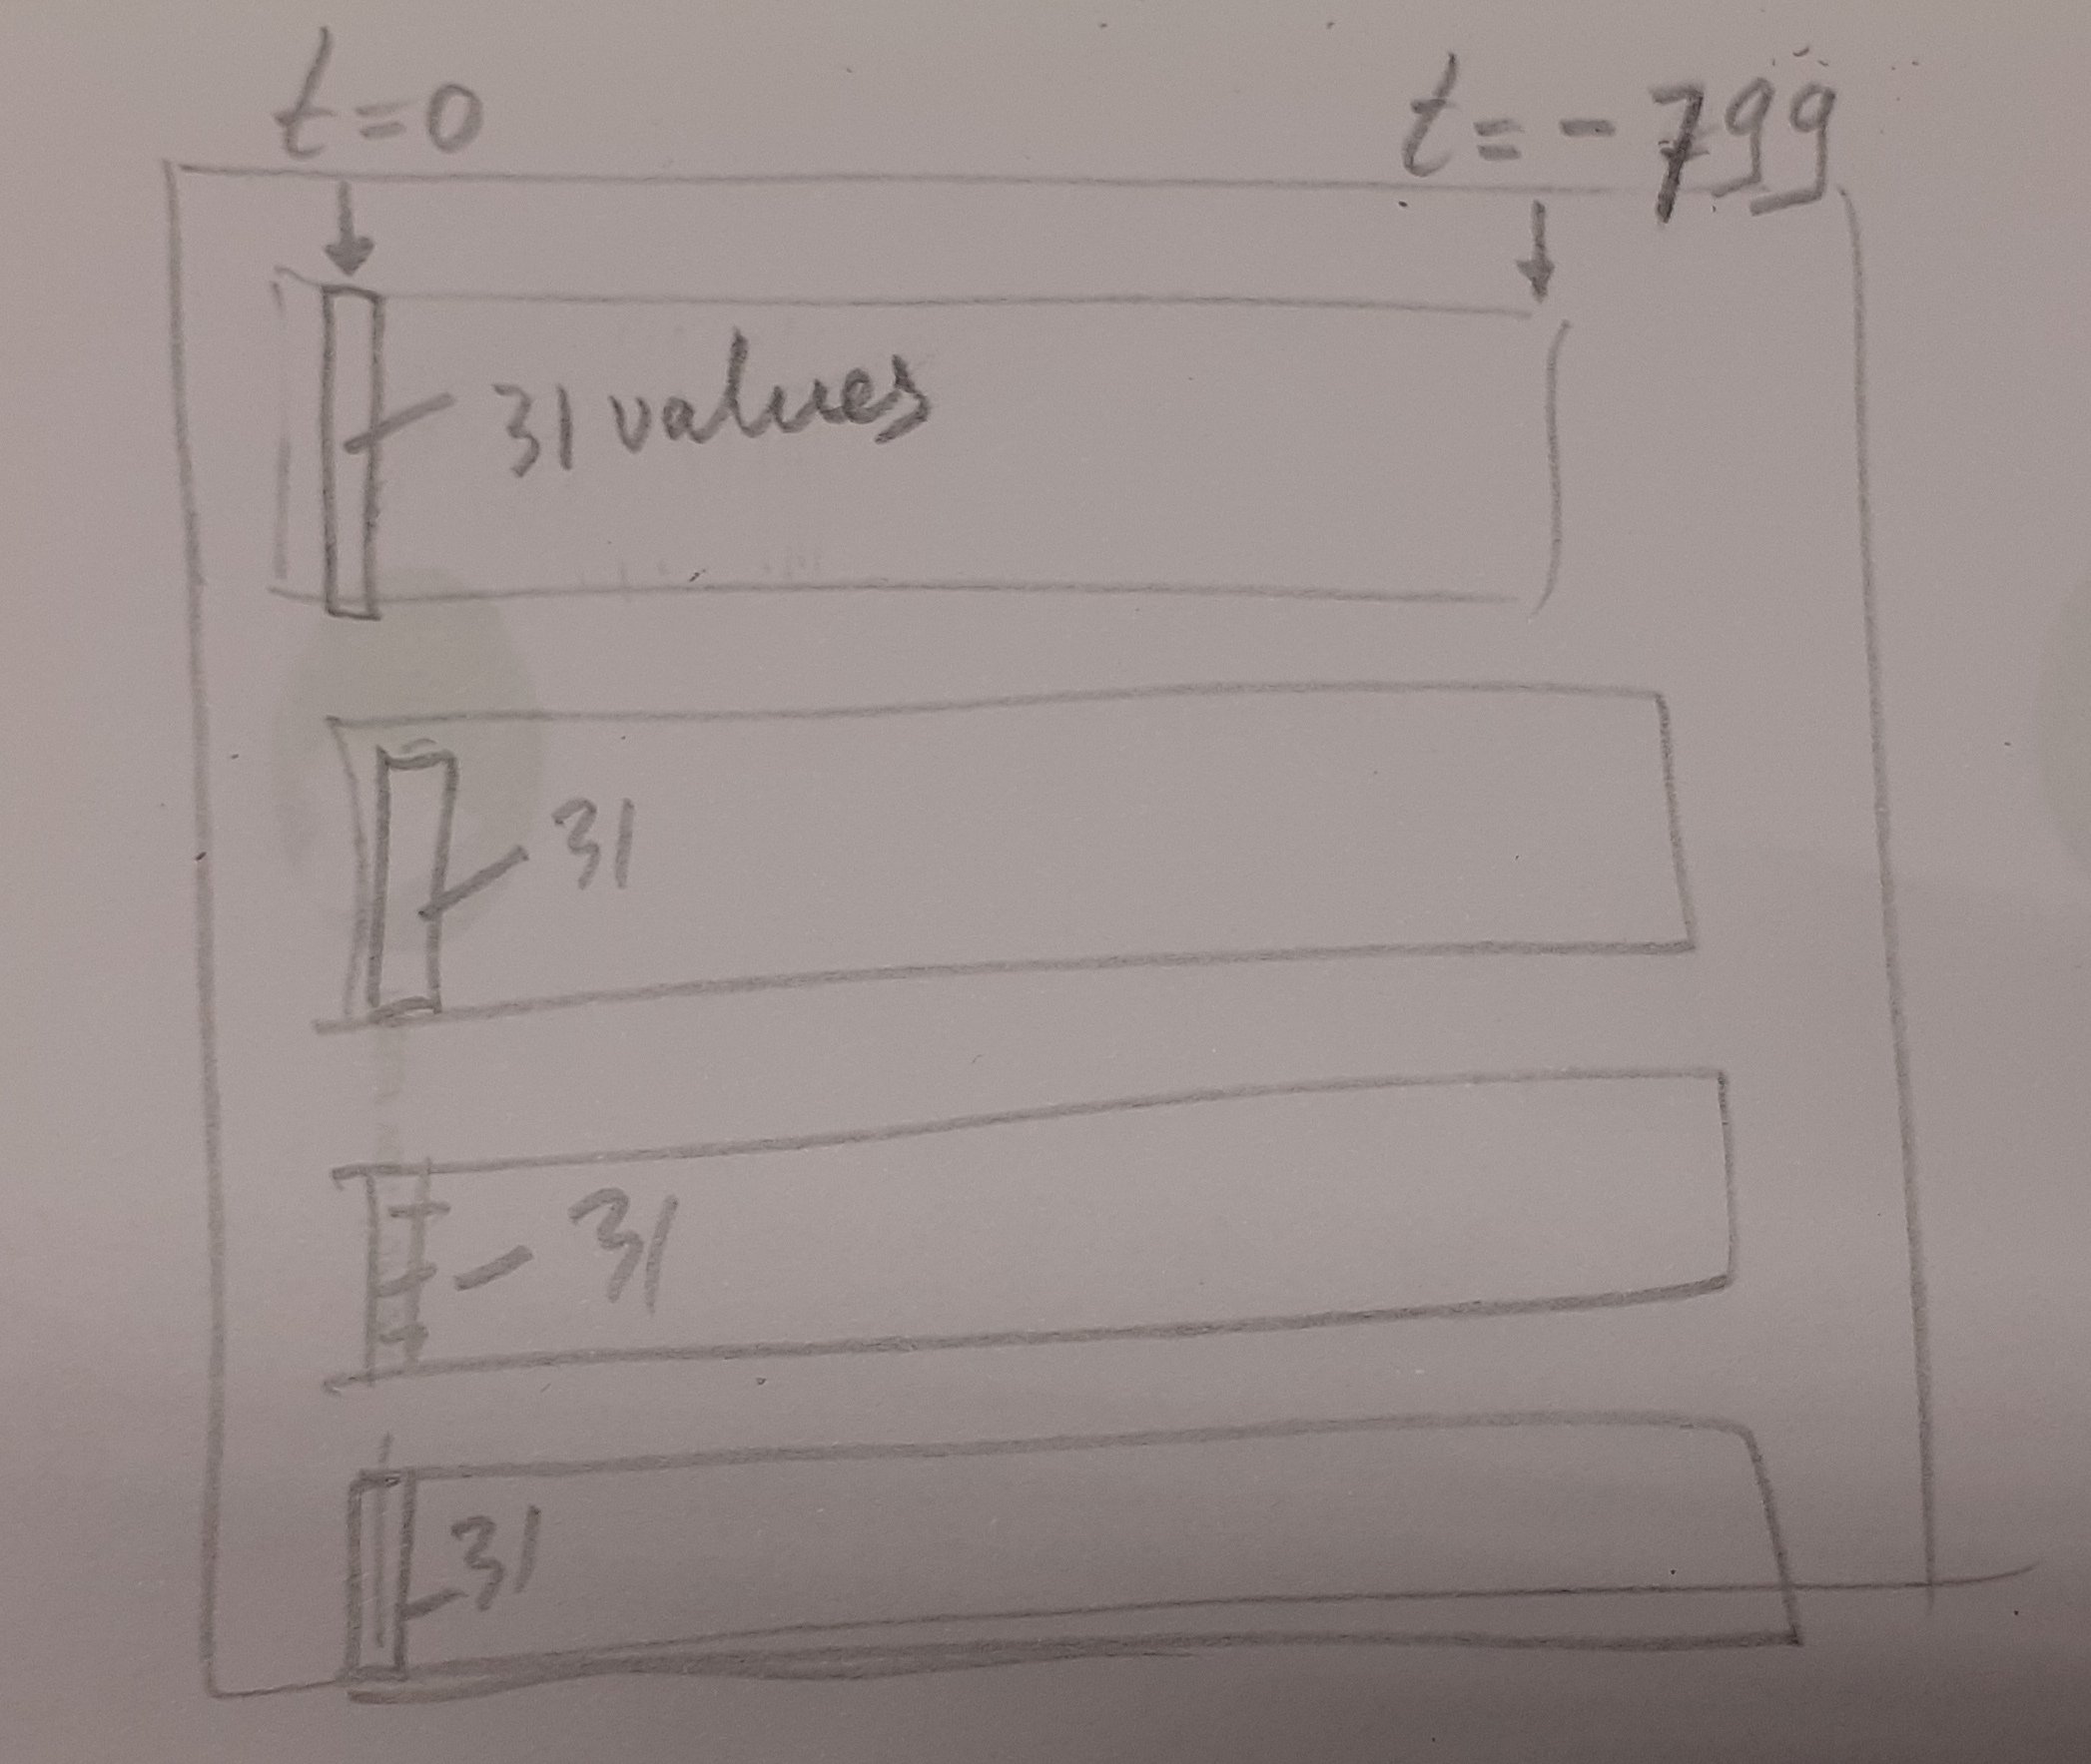
Now let’s see if I have the vertical scope. There are 4 groups of data each on having 31 values per time slice. That simply equates to 124 values in total per time slice. Minimal display of those values would require 1 pixel per value and would be organized as
Please bear with my childish-like explanation above as I attempt to expand upon that foundation. Using our 800 pixel dis[lay we find that we can fit 6 full sets of 124 values onto the screen. The software will need to add 5 pixels between each reading and calculate a suitable value for them using simple linear interpolation or whatever other technique may be more appropriate due to gaps or overlaps between bands.
Per panel 31 valued vectors are displayed next to one another.
Edit: in stead of showing new pixels on the left and shifting everything to the right, an alternative way of showing the spectral content is to move the point where the new data is put from right to left (in a cyclic way), so t = 0 ( the present moment ) moves from left to right and overwrites old data, as shown here (RHS):
What we are building here is analogous to a ring buffer used in a delay line audio effect. We will be able to add a feature that will allow you to toggle between having t0 fixed to the left or float as each new sample arrives. Hmmm sounds like I’m describing the framework for a program.
Working with a 1280 wide by 800 high screen would be able to display up to 1280 time samples ( t0 - t1179 ). The question that arises here is what is the fastest time sample rate? Another critical variable to define is what is the largest energy value? We need to know how to prescale each value to keep data communication as efficient as possible (the less bytes, the better). If the display is capable of 16000+ colors then 16 bit unsigned integers are used. if 256 colors are adequate then 8 bit unsigned integers are used.
This is not much of a qualified contribution but I just want to say I love what you did here. As soon as I am more experienced with programming and the daisy environment I want to get this working on my daisy patch so bad!
I don’t know, I do not own one, but I think it will sound the same. My dev-board uses the same outputs, so I don’t expect much differences. I’m haven’t started working on the spectral display but hope to be able to start that soon. Once that is working I plan to build my own pcb version of the daisy patch (including the display).
The nucleus of the code is available as Vocode-O-Matic for VCV-Rack at my github. With a few simple changes you can adapt that for the Daisy Seed. I haven’t set up a repository for the Daisy Code but plan to do so as soon as I get the energy display to work.