Hi, yeah I managed to get the debugging working (with a ST-Link and JTAG adaptor) in VSCode on mac last night, with the help of shensley over on another thread. As far I remember here are my steps:
Install Daisy mac toolchain with homebrew as per the Daisy wiki.
Update ST-Link firmware if not up to date - I had to do this on windows, as STLink utility is only for windows.
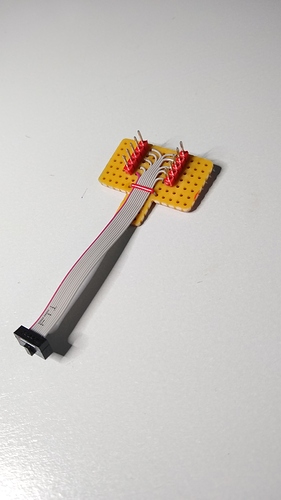
Plug in ST-Link to Daisy using jtag connector
Also plug in Daisy to computer using USB
Install openOCD using xpack: https://xpack.github.io/openocd/install/
(also need to install xpm, follow the link on that page)
Add openOCD install path to $path from terminal:
sudo nano /etc/paths
ctrl-x to exit, Y then enter to save.
Start a fresh terminal.
Test openOCD from terminal with:
openocd -f interface/stlink-v2.cfg -f target/STM32h7x.cfg
You should get an output like this:
Info : Listening on port 6666 for tcl connections

Info : Listening on port 4444 for telnet connections

Info : clock speed 1800 kHz

Info : STLINK V2J34S7 (API v2) VID:PID 0483:3748

Info : Target voltage: 3.175214

Info : stm32h7x.cpu0: hardware has 8 breakpoints, 4 watchpoints

Info : starting gdb server for stm32h7x.cpu0 on 3333

Info : Listening on port 3333 for gdb connections
Download and install GNU arm tool chain:
https://developer.arm.com/tools-and-software/open-source-software/developer-tools/gnu-toolchain/gnu-rm/downloads
Install Cortex Debug extension for VS Code (search for it on VS Code View -> Extensions)
Download STM32H750x.svd file from here:
https://github.com/posborne/cmsis-svd/tree/master/data/STMicro
Copy STM32H750x.svd into main .vscode directory
Create new workspace in VSCode and put the DaisyLibrary in the directory
Create project folder and write .cpp file or use example file.
Copy in make file example, change to correct paths and file names
add in line: DEBUG = 1 to make file (new line under Target = XXX)
In a new terminal in VSCode cd to project directory and type
make
This will compile program. Then press reset and boot buttons on daisy and type (in terminal):
make program-dfu
(should now flash Daisy)
Create launch.json file in VS Code by clicking on Run -> Add Configuration
Replace all text in launch.json with the following:
{
    // Use IntelliSense to learn about possible attributes.
    // Hover to view descriptions of existing attributes.
    // For more information, visit: https://go.microsoft.com/fwlink/?linkid=830387
    "version": "0.2.0",
    "configurations": [
        {
            "name": "Cortex Debug",
            "cwd": "${workspaceRoot}",
            "executable": "{$workspaceRoot}/build/YOURFILENAME.elf",
            "request": "launch",
            "type": "cortex-debug",
            "servertype": "openocd",
            "configFiles": [
                "interface/stlink.cfg",
                "target/stm32h7x.cfg",
            ],
            "openOCDLaunchCommands": ["init", "reset init"],
            "runToMain": true,
            "svdFile": "./.vscode/STM32H750x.svd"
        }
    ]
}
Update executable location to point at your recently created .elf file.
Hit debug button, then green triangle at the top left (Cortex Debug). Add in breakpoints and watches as necessary, step through program in debugger.
Hopefully that helps! The Cortex Debug extension supports other debugger hardware as well, but I haven’t tried.
Cheers,
Adam
